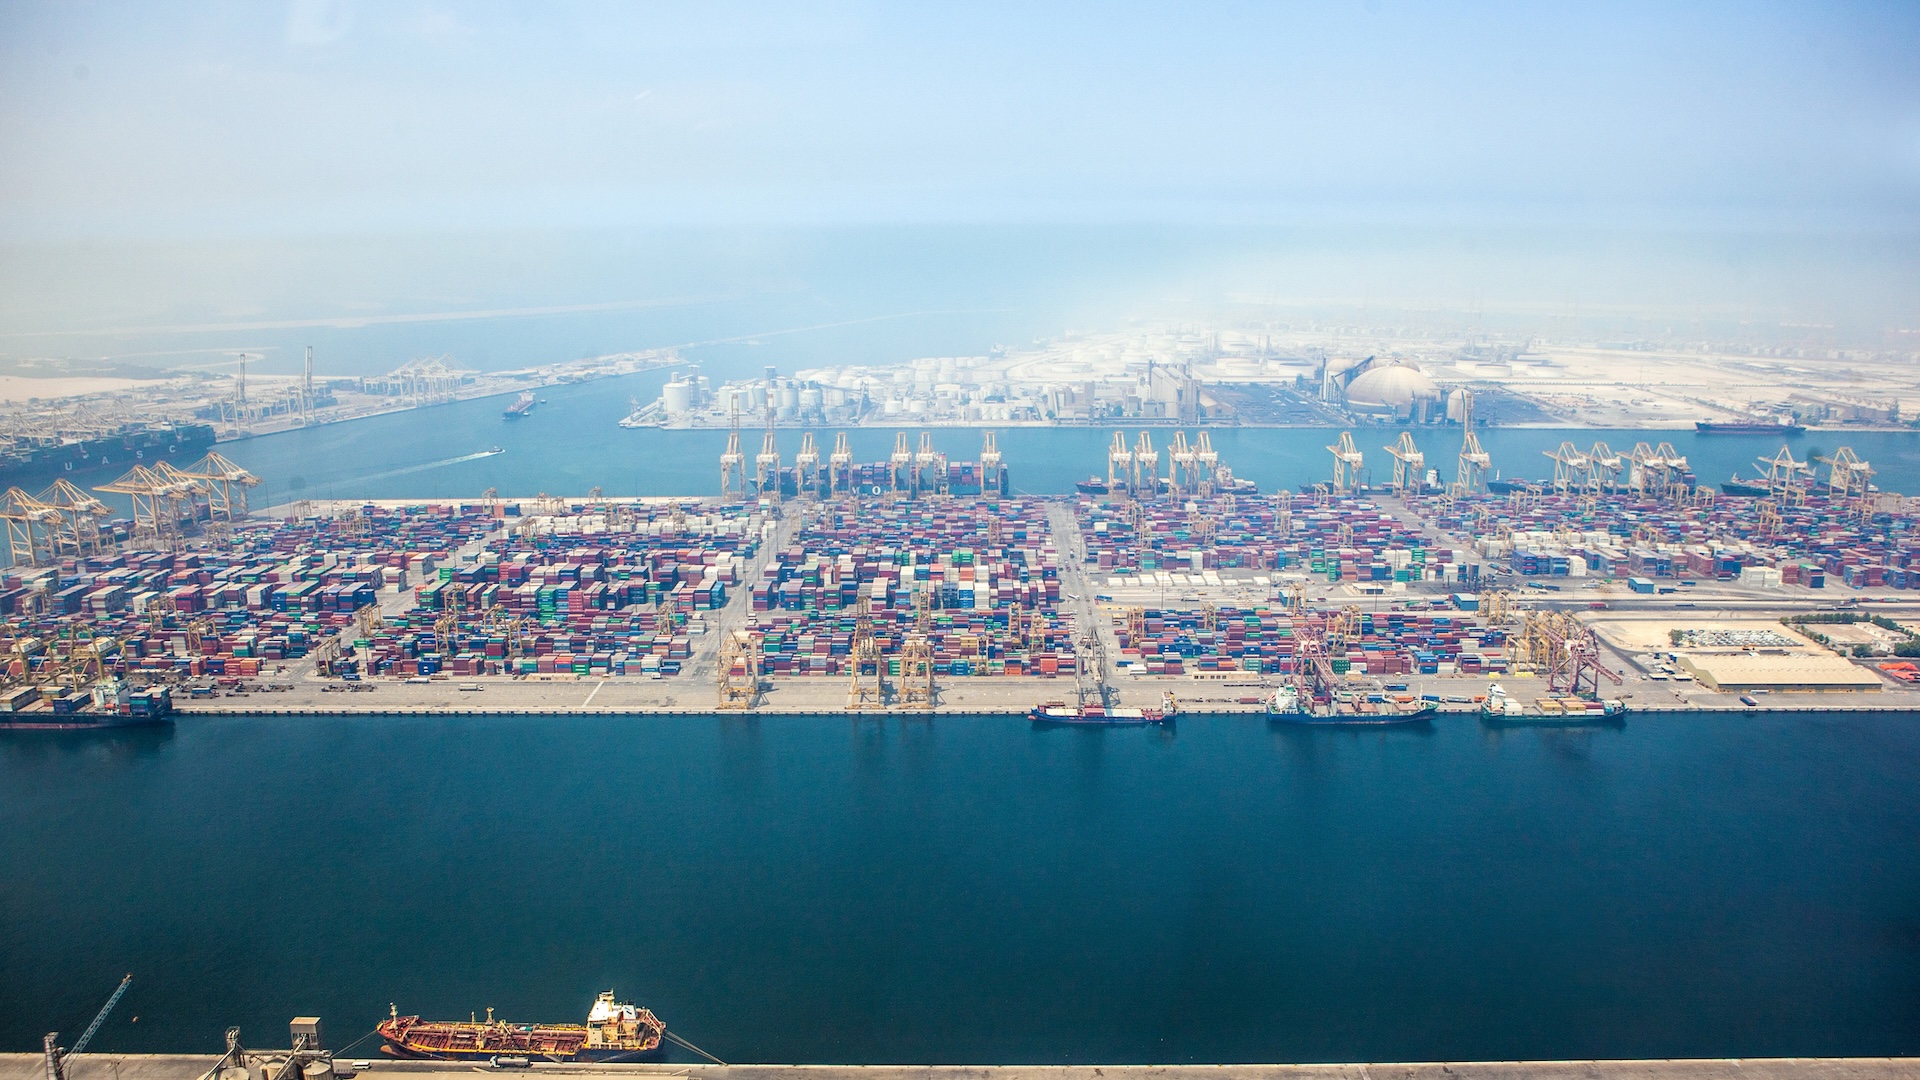
It’s been seven months to the day since the Strait of Hormuz crisis began in late February, blocking shipping traffic from entering or leaving the Persian Gulf for much of the year.
After initial hostilities and a near-total closure of shipping activity through the Strait, an initial 60-day ceasefire negotiated in June offered the promise of a return to more normal maritime activity in the Gulf. But that ceasefire collapsed in July, just one month after it began. The U.S. and Iran resumed military strikes on maritime vessels in a renewed struggle for control over the Strait.
Now in late September, Iran says it could reopen the Strait within seven days if it and the US could agree on a path forward.
Much has been written about the blockade’s impact on shipping traffic and the various global markets that depend on it — oil, LNG, sulfur, fertilizer, goods. Less has been written about what the sharp reduction in shipping traffic has meant for maritime and port emissions in the countries that line the western shores of the Persian Gulf.
In this piece, we take a look at nine major ports and their shipping activity… spanning Iraq and Kuwait in the north, through Saudi Arabia, Bahrain, and Qatar, to the United Arab Emirates just inside the mouth of the Strait.
Serving as a vital bottleneck for the global fossil fuel trade, the Strait of Hormuz is a narrow, highly vulnerable waterway between Iran, Oman, and the UAE that forms the sole sea entrance to the Persian Gulf.
About 25% of the world's seaborne oil trade passes through it, with few alternative routes for major exporters like Iran, Iraq, Kuwait, Qatar, and Bahrain. The Strait is also critical for natural gas, carrying nearly 20% of global LNG exports from Qatar and the UAE alone. Likewise, roughly half of the world’s seaborne sulfur trade and one-third of global urea passes through the Strait (with consequential impacts for global fertilizer markets).
Everything changed for this keystone of global trade in early 2026, when U.S. and Israeli airstrikes prompted Iran to close off the strait, attacking commercial vessels that didn't comply with its new transit rules and leaving tankers and carriers waiting offshore rather than risk the crossing.
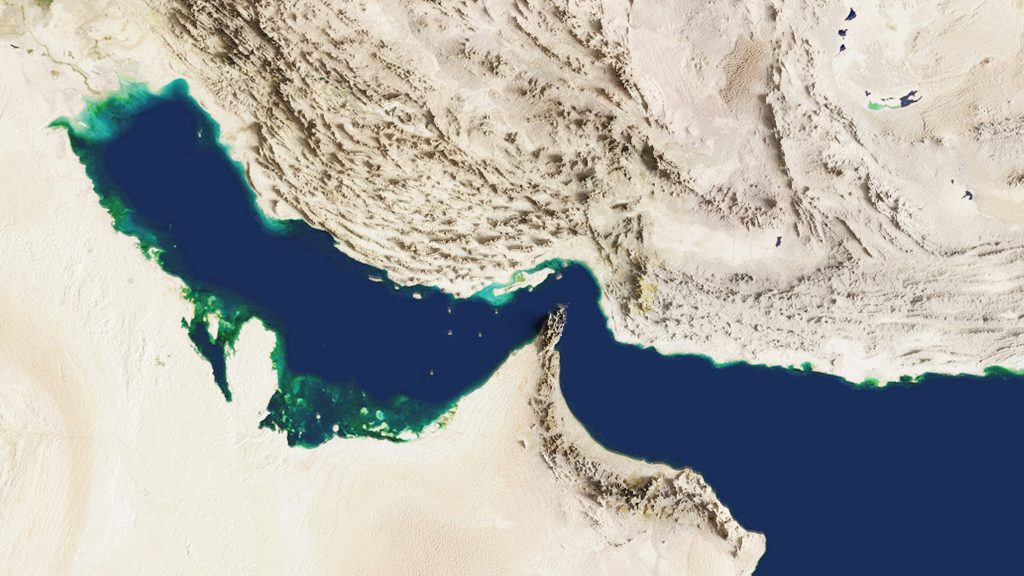
Persian Gulf ports saw a steep drop in vessel activity as a result, as traffic through the chokepoint plummeted from more than 100 vessels a day to an average of just five.
Ports like Ras Laffan and Jebel Ali — once among the region's busiest hubs for LNG and container traffic — have seen their volumes shrink drastically: QatarEnergy declared force majeure on Ras Laffan shipments after March attacks damaged its facilities, while operator DP World has been spending roughly $100 million a month to keep Jebel Ali ready to resume full operations within 48 hours of any reopening.
Monthly data from the IMO on average daily transits through the Strait show that — other than a temporary rebound during the June-July ceasefire — traffic through Hormuz remains low.
Across the nine ports we investigated along the western shores of the Persian Gulf, vessel activity fell sharply in lockstep step with the closure.
(Note: for this analysis, we pulled the data as OceanMind formats it for Climate TRACE, with vessel activity in nautical miles and emissions in tonnes CO2e allocated between origin and destination ports. We are also able to parse the data by vessel, company, flag state, and other attributes, upon request.)
Combined monthly shipping activity and corresponding emissions at the nine ports both dropped an incredible 97% between January 2026 and May 2026. The steepest declines spanned the period February–April, coinciding with the start of the conflict and closure of the Strait.
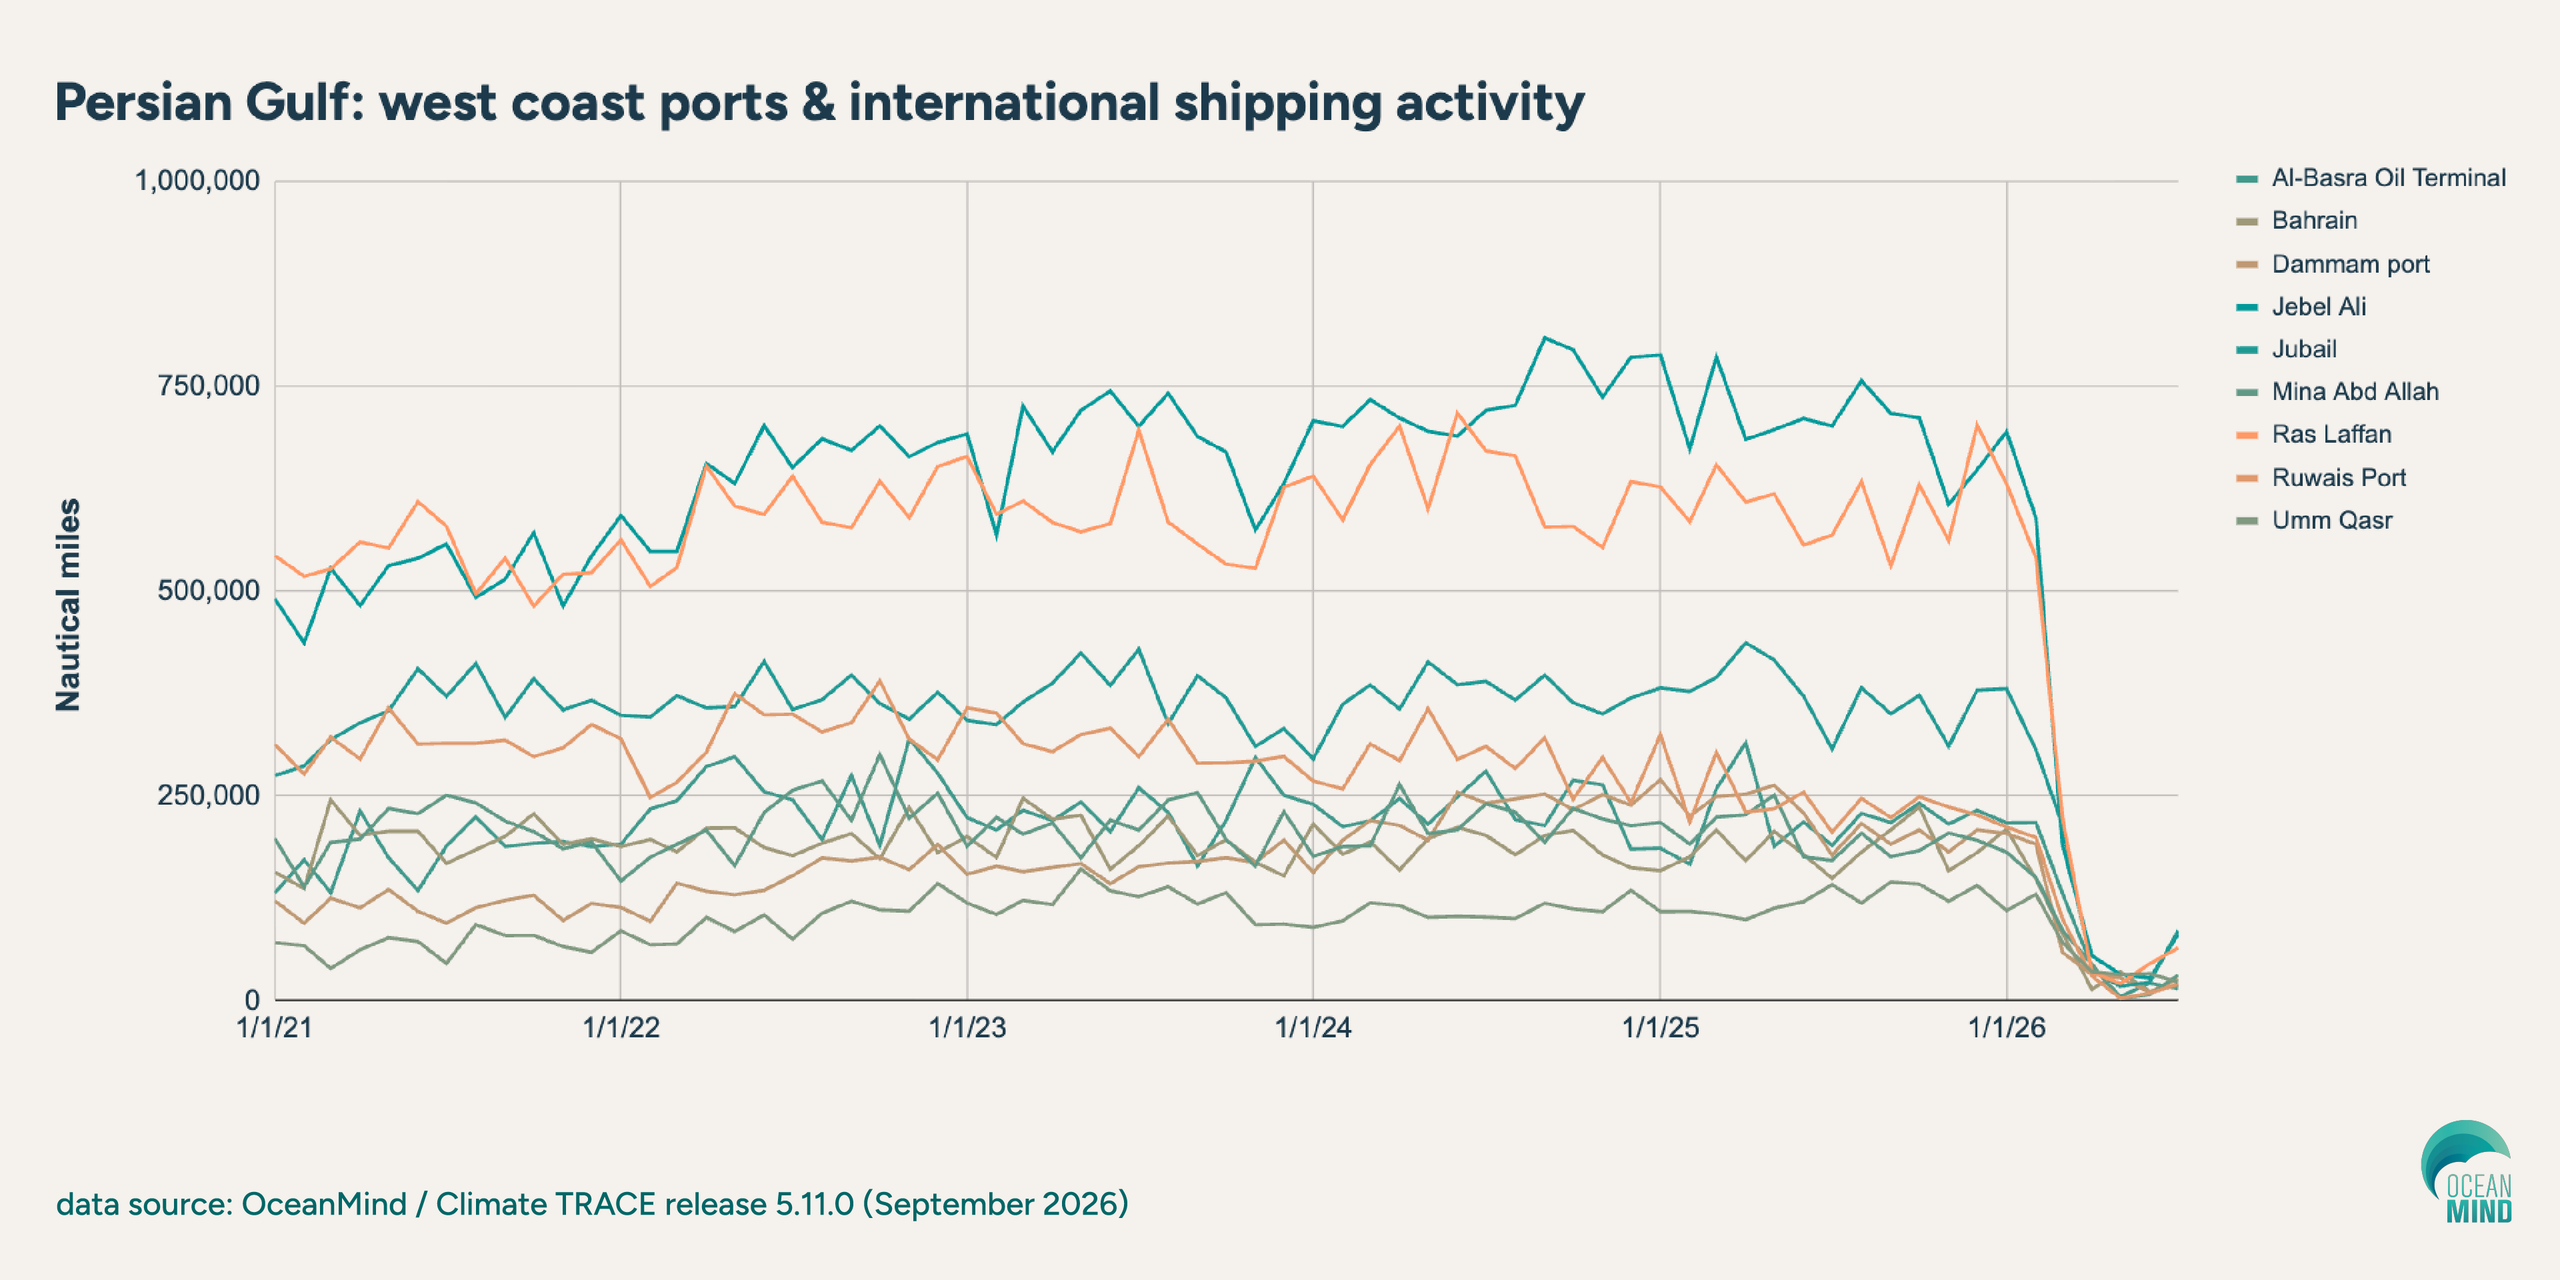
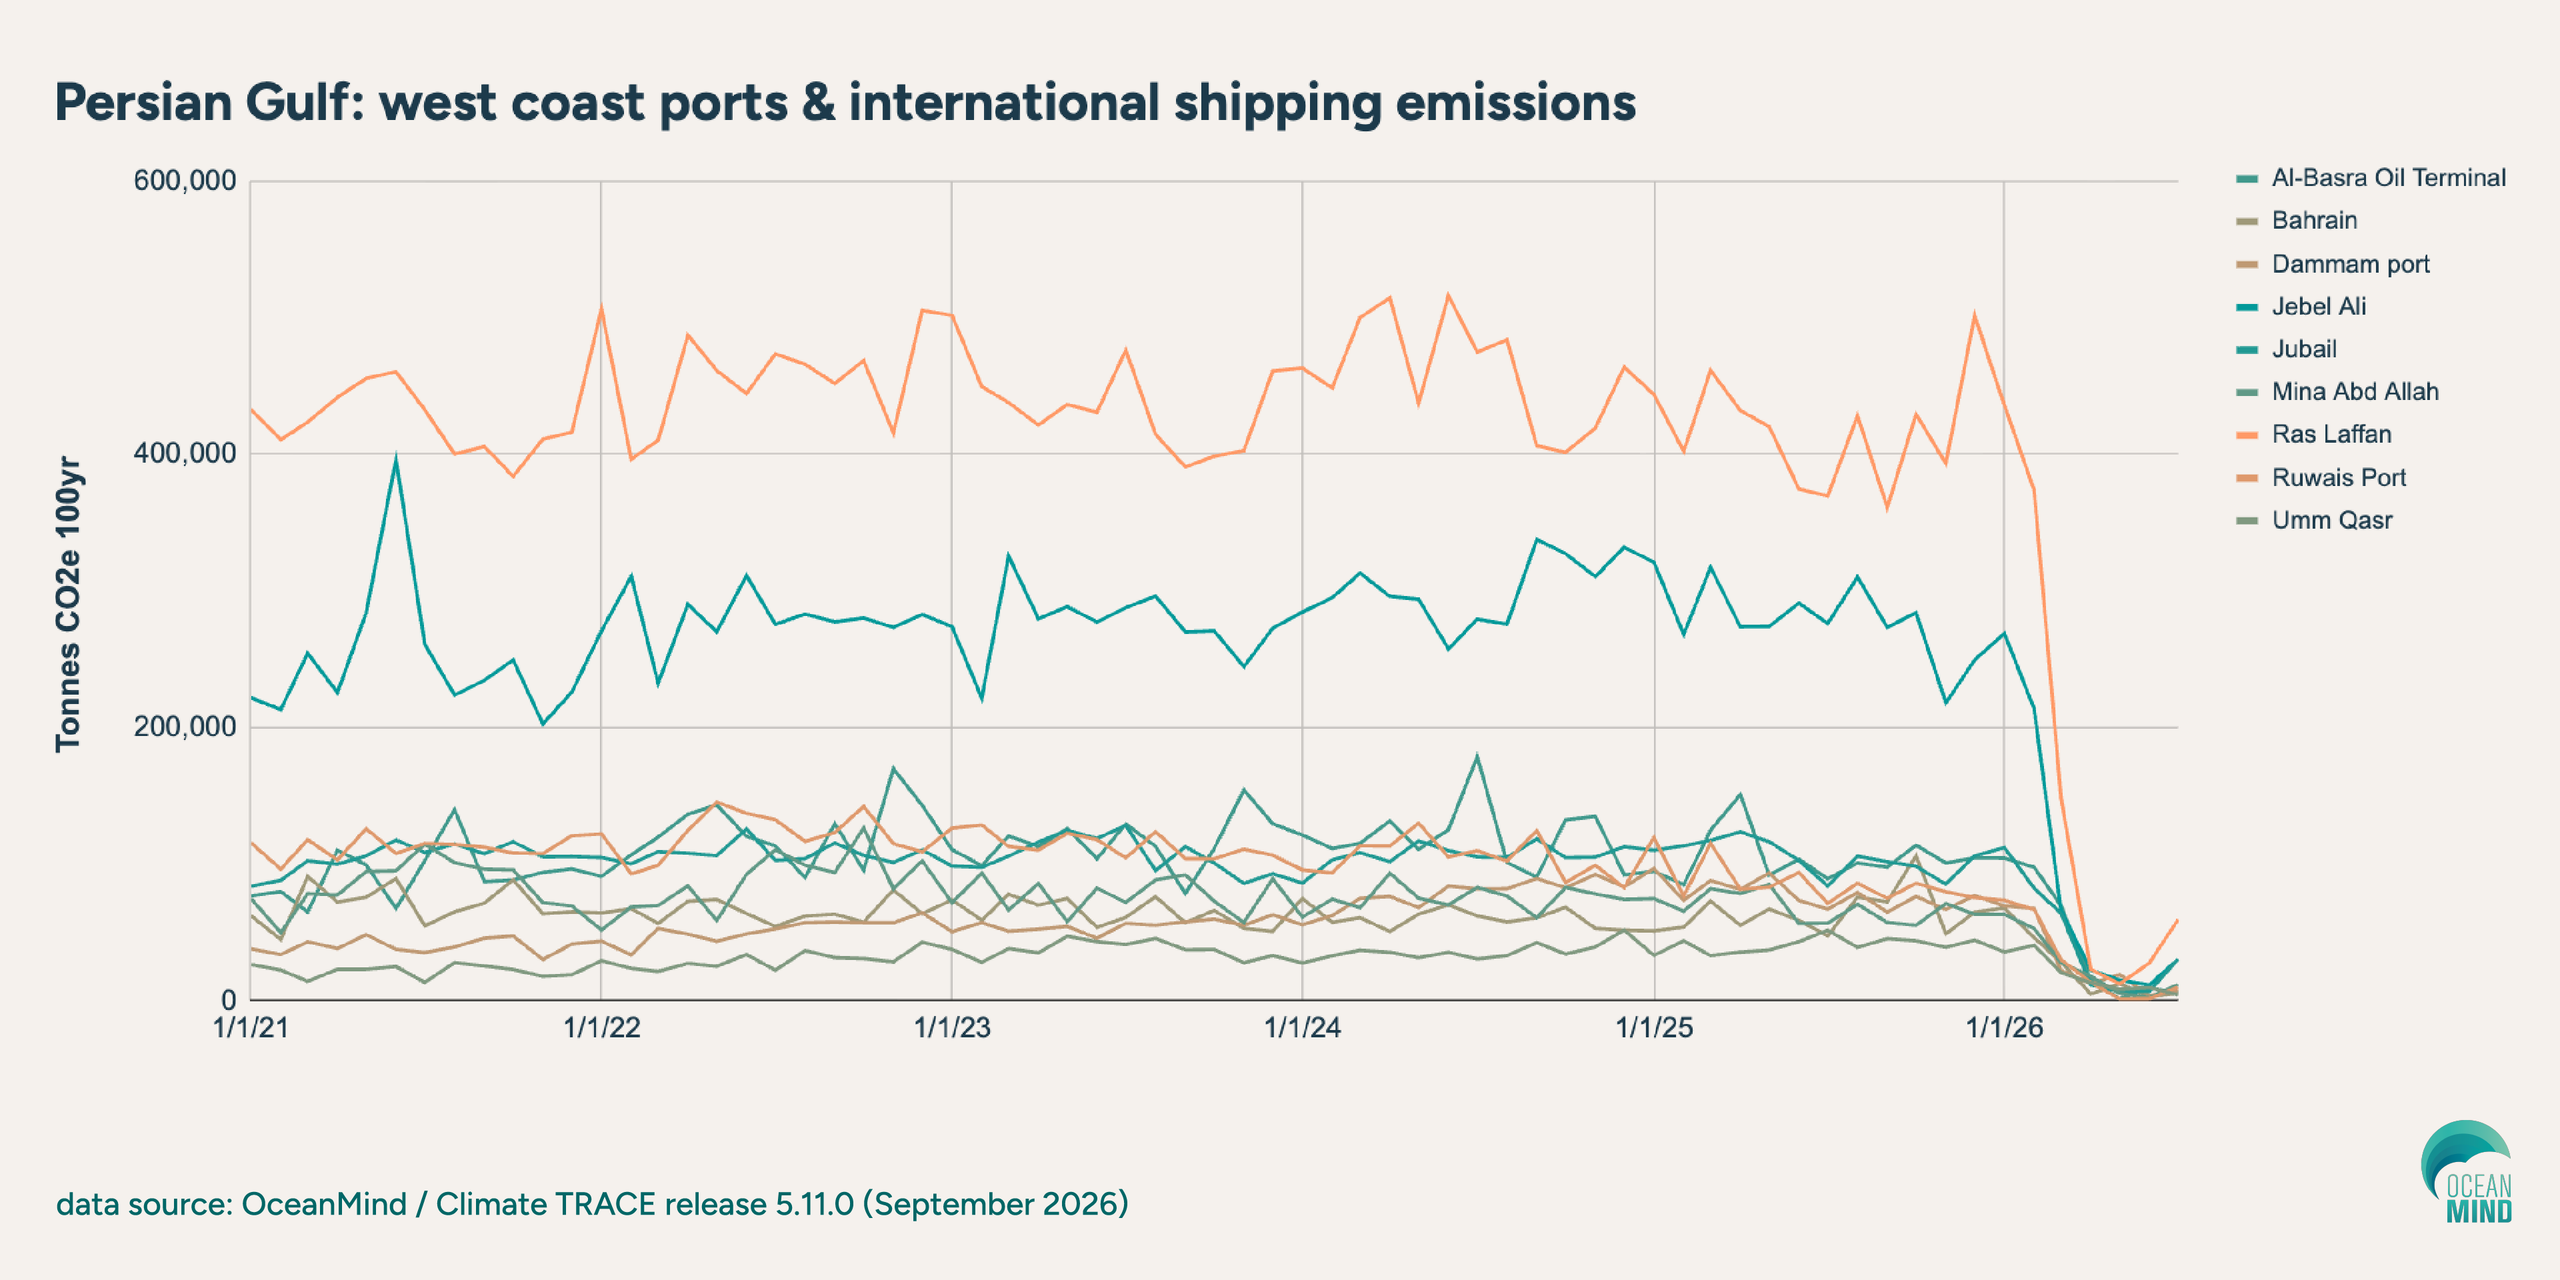
Ras Laffan, Qatar’s dedicated LNG export terminal, operates 14 gas liquefaction trains with a nameplate capacity of 77 million tonnes per year — roughly a quarter of the entire global LNG trade — and typically handles over 1,500 dedicated LNG tanker calls annually.
Nearly all of that volume depends on the Strait, with 93% of Qatari LNG exports transited through Hormuz in 2025 and no practical alternative route. Vessel activity at the port dropped sharply in step with each phase of the closure. Emissions at Ras Laffan follow the same trajectory, falling in close correlation with the decline in tanker calls.
Meanwhile Jebel Ali, Dubai's flagship deep-water port, is the busiest container hub in the Middle East and ranked ninth busiest in the world after handling 15.5 million TEUs in 2024.
As the region's dominant transshipment gateway, its exposure to the closure has been severe: container volumes fell more than 90% year-over-year in the second quarter of 2026 alone. Emissions tied to the port have fallen just as sharply, tracking closely with the drop in vessel calls.
Both ports saw small upticks in activity and emissions during the Jun–Jul ceasefire, but that was short-lived. LNG shipments to and from Ras Laffan ground to a near-halt again in August. While earlier this month, media outlet Semafor described an “eerie silence” at Jebel Ali.
These data shows how quickly the Strait of Hormuz closure brought Gulf shipping to a standstill, and how directly that standstill shows up as a drop in port activity and vessel emissions.
Making this kind of detailed, continuously updated tracking publicly available — as OceanMind does as the shipping sector lead for Climate TRACE — gives a far sharper lens on both the trade and environmental costs of a major shipping disruption.
With that visibility, industry leaders and policymakers are better positioned to plan for whatever disruption comes next.